Business
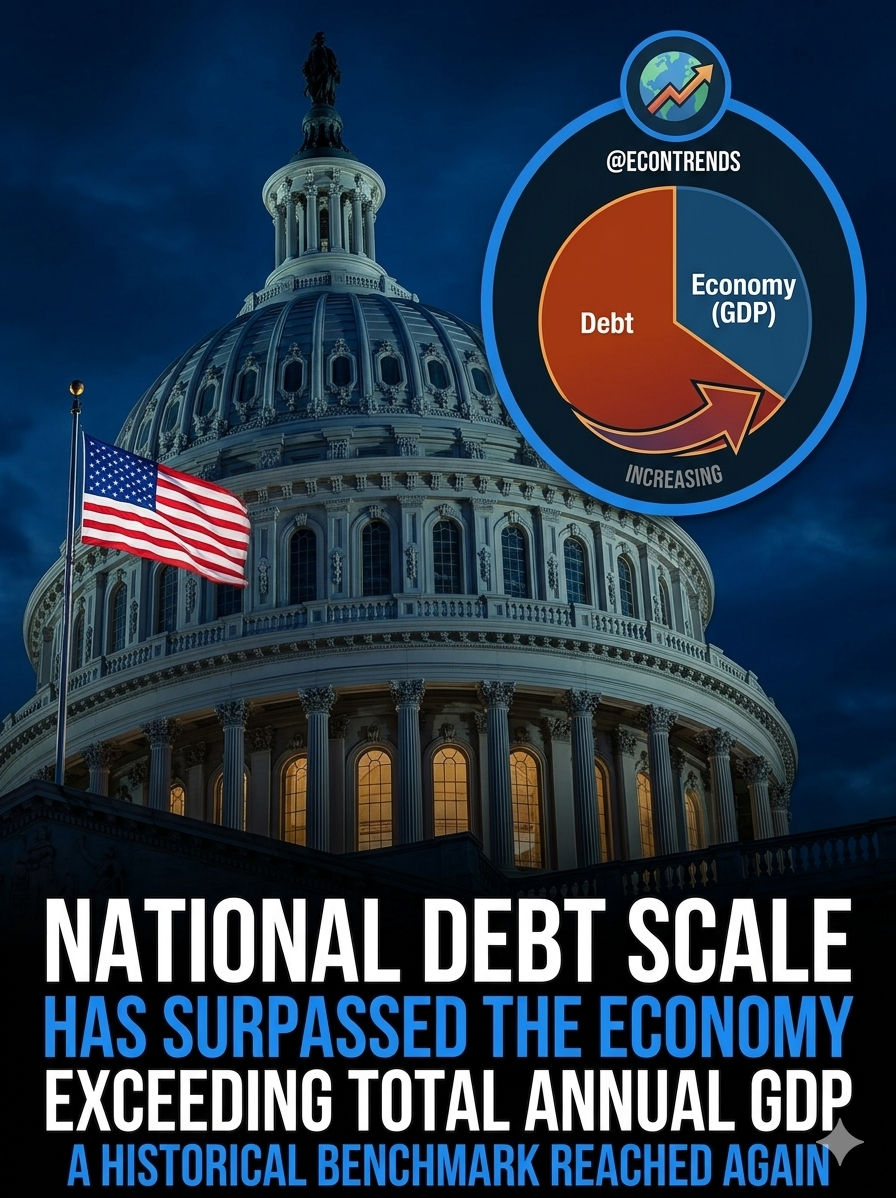
U.S. National Debt Surpasses 100% of GDP for First Time Since World War II — What It Means for America's Financial Future
New federal data confirms America now owes more than its entire economy produces, raising urgent questions about fiscal sustainability
By CM NEWS — June 1, 2026
For the first time since the aftermath of World War II, the United States national debt has officially exceeded the total size of the American economy. New data released by the Bureau of Economic Analysis confirms a milestone that fiscal watchdogs have long warned was approaching — and the numbers paint a sobering picture of the country's financial trajectory.
As of March 31, 2026, debt held by the public stood at $31.27 trillion, while nominal GDP over the prior 12-month period was estimated at $31.22 trillion — placing the debt-to-GDP ratio at 100.2%. [Committee for a Responsible Federal Budget] The last time this ratio crossed that threshold in a sustained way, American soldiers were returning home from the battlefields of Europe and the Pacific.
Key Facts at a Glance
- Debt held by the public: $31.27 trillion
- U.S. annual GDP: $31.22 trillion
- Current debt-to-GDP ratio: 100.2%
- Post-WWII peak: 106% (1946)
- CBO projection by 2036: 120%+
- Government currently spends: $1.33 per $1 collected in taxes
The Full Picture: How America Got Here
The crossing of the 100% debt-to-GDP threshold did not happen overnight. It is the result of decades of structural deficits, emergency pandemic spending, recurring tax cuts, and rising entitlement costs — none of which were ever fully offset by corresponding revenue increases or spending reductions.
Outside of a brief period during the COVID-19 pandemic — when GDP temporarily contracted — debt has only exceeded GDP for two years in American history, at the end of World War II. In the two decades that followed that peak, the debt-to-GDP ratio was reduced dramatically to 34%. [Committee for a Responsible Federal Budget] That recovery was driven by a post-war economic boom, sustained growth, and a federal government that was winding down wartime expenditures.
Today's near-historic debt levels were noted by the Wall Street Journal, which highlighted that the government is currently spending $1.33 for every dollar of tax revenue it collects. [Committee for a Responsible Federal Budget] That gap — the structural deficit — is what continues to push the debt higher even in the absence of a new crisis.
Maya MacGuineas, president of the Committee for a Responsible Federal Budget, stated: "It's happened — the national debt is now larger than the U.S. economy, about twice the historic average. We've heard plenty of alarm bells in the past few years about our fiscal path, but this one rings especially loudly. The real question is whether or not our leaders in Washington will listen." [Committee for a Responsible Federal Budget]
How Does This Compare to World War II?
The historical comparison is instructive — and uncomfortable. When the U.S. debt-to-GDP ratio peaked at 106% in 1946, it reflected the cost of funding the most destructive and expensive conflict in human history. The United States had mobilized its entire industrial economy, fielded millions of troops, and bankrolled significant portions of the Allied war effort.
The justification for that debt was clear: the survival of democratic governance across multiple continents.
The Congressional Budget Office projects that federal debt held by the public will rise from 101% of GDP in 2026 to 120% of GDP by 2036, surpassing the post-World War II record of 106%. [Financer] This time, there is no war being wound down, no temporary emergency driving the numbers. The debt is structural, and it is growing.
What Is Driving the Debt Higher?
Several long-term forces are converging to keep deficits wide and debt climbing:
Entitlement spending. Social Security and Medicare costs are rising steadily as the U.S. population ages. A major driver of future debt growth is America's aging population, which is creating structural spending pressures that operate largely independently of short-term policy choices. [Financer]
Interest costs. As total debt rises and interest rates remain elevated compared to the low-rate era of the 2010s, the cost of servicing the debt is consuming a growing share of the federal budget. Annual interest payments on the national debt have now exceeded $1 trillion — more than the U.S. spends on defense.
Recurring deficits. The fiscal 2026 deficit is projected to come in at roughly $1.89 trillion, or 5.9% of GDP, up from $1.775 trillion in fiscal 2025 — representing the difference between $7.385 trillion in spending and $5.495 trillion in revenues. [J.P. Morgan Asset Management]
Analysis: Why the 100% Threshold Matters
The 100% debt-to-GDP ratio is not merely symbolic. It is a widely used benchmark among economists, credit rating agencies, and international financial institutions to assess a country's fiscal sustainability and borrowing risk.
When debt exceeds GDP, it signals that a nation's total obligations now outpace its annual productive capacity. It raises questions about the government's long-term ability to service that debt without either raising taxes significantly, cutting spending sharply, inflating the currency, or some combination of all three.
At 100% of GDP, U.S. debt is roughly twice the historical average, [Committee for a Responsible Federal Budget] meaning the country has moved well outside the range that characterized most of American fiscal history. The longer that ratio remains elevated — or continues to climb — the more it constrains future policy options and potentially raises borrowing costs for both the government and ordinary Americans.
J.P. Morgan Asset Management analysts have noted that an increase in the debt-to-GDP ratio from 100% to 130% by 2036 could boost long-term interest rates meaningfully — a development that would ripple through mortgage rates, business lending, and consumer credit across the entire economy. [J.P. Morgan Asset Management]
What Happens Next?
The trajectory, absent significant policy changes, points upward. Today, debt is projected to reach 125% of GDP by 2036. [Committee for a Responsible Federal Budget] Under more pessimistic scenarios that account for potential further tax legislation and higher defense spending, the debt-to-GDP ratio could rise to 127.7% of GDP or higher by 2036. [J.P. Morgan Asset Management]
Congress and the White House face a narrow set of options: raise revenues, cut expenditure, restructure entitlement programs, or accept the long-term consequences of continued borrowing. None of those paths are politically straightforward, and the history of the past two decades suggests that both major parties have consistently chosen to defer the hardest choices.
The 100% threshold will not, by itself, trigger an immediate financial crisis. The United States still benefits from the dollar's status as the world's reserve currency, which allows it to borrow at relatively favorable rates. But that advantage is not unconditional — and market confidence can shift faster than policymakers typically anticipate.
Conclusion
The crossing of the 100% debt-to-GDP threshold marks a genuine inflection point in America's fiscal history. The numbers are not partisan — they are mathematical. The last time the United States was in this position, it had just helped win a world war. Today, the drivers are slower-moving but no less significant: an aging population, a structural spending gap, and a political system that has so far struggled to confront the long-term consequences.
Whether Washington responds with meaningful fiscal reform — or continues on the current path — will have lasting consequences for the American economy and for every generation that follows.
Sources: Committee for a Responsible Federal Budget (CRFB), Bureau of Economic Analysis (BEA), Congressional Budget Office (CBO), J.P. Morgan Asset Management, Wall Street Journal